What’s Eddington?
Eddington is a user-friendly data fitting platform for common uses, based on open-source libraries such as numpy, scipy, and matplotlib.
Core abilities
With Eddington you can:
- Fit data according to fitting functions.
- Use a vast list of supported out-of-the-box fitting functions.
- Plot results into useful figures to evaluate your results.
- Filter your data in order to get best results.
- Save your results into files.
Usage
Eddington can be operated in 3 major ways:
As a Library
With just 4 lines of code you can fit your data easily and surely:
from eddington import FittingData, fit

from eddington import linear  # Import the needed fitting function

data = FittingData.read_from_csv("/path/to/data.csv")  # Read the data from a file

result = fit(data, linear)  # Fit the data

print(result)  # Print the result or export to file
The Eddington library is simple, intuitive and easy to use for all developers with basic
knowledge of python. Install the Eddington library with pip install eddington.
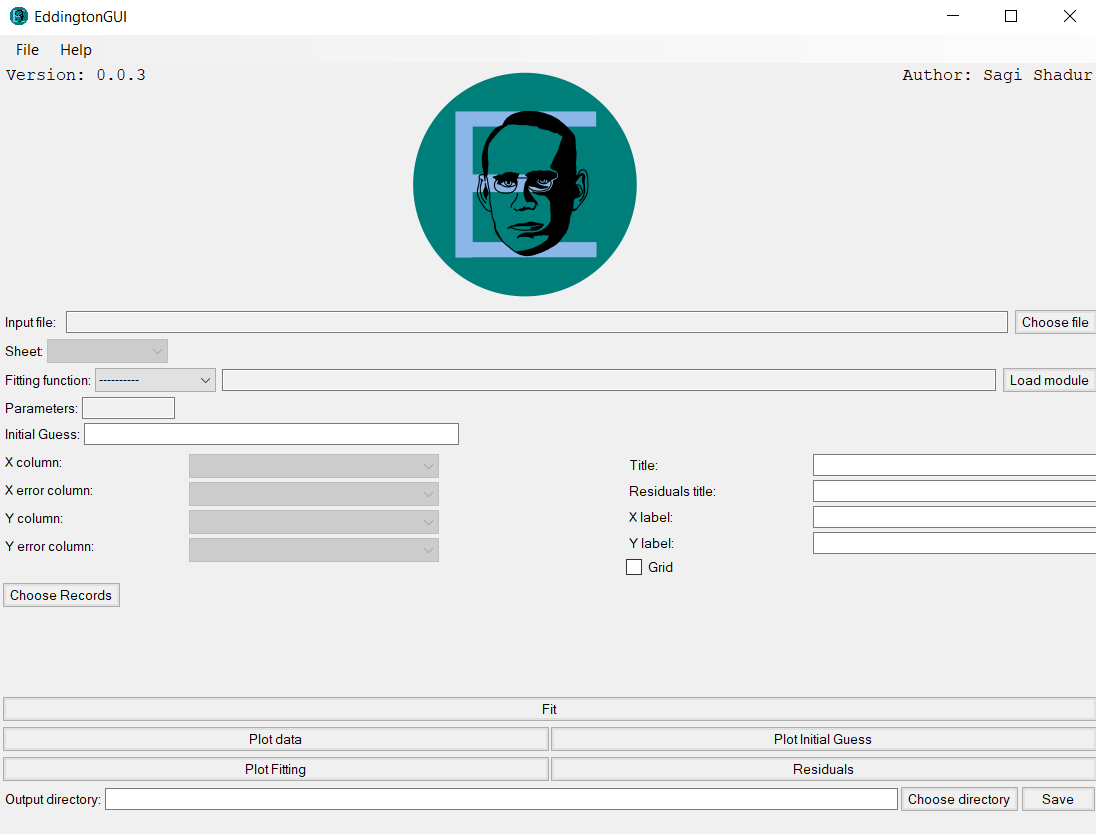
As a Command-Line Interface (CLI)
Install Eddington-CLI using pip install eddington-cli and run Eddington via
the command line:
>> eddington fit hyperbolic --data=/path/to/data.csv
Fitting hyperbolic (a[0] / (x + a[1]) + a[2])
Results:
========

Initial parameters' values:
        1.0 1.0 1.0
Fitted parameters' values:
        a[0] = 245.670 ± 8.530 (3.472% error)
        a[1] = -16.329 ± 0.1228 (0.7518% error)
        a[2] = 14.515 ± 0.5415 (3.731% error)
Fitted parameters covariance:
[[ 1.834e+02  2.579e+00 -1.145e+01]
 [ 2.579e+00  3.799e-02 -1.560e-01]
 [-1.145e+01 -1.560e-01  7.390e-01]]
Chi squared: 3.174
Degrees of freedom: 8
Chi squared reduced: 0.3968
P-probability: 0.9230